FORCED DISPLACEMENT
Finding 6: Exclusion from decisions
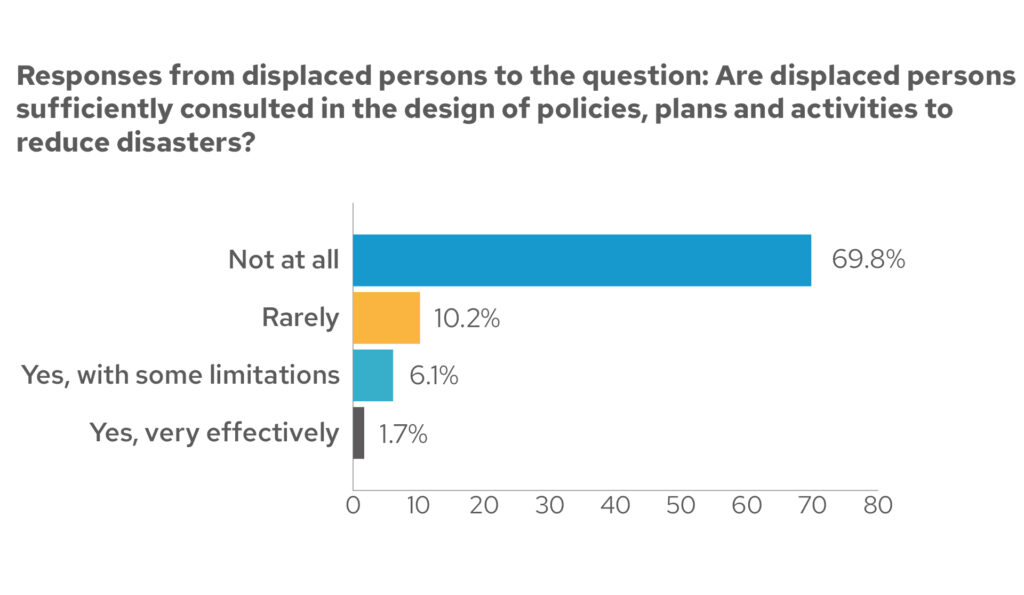
Displaced communities most at risk, especially women, are not adequately being involved in decisions that affect them.
Two thirds of respondents feel they are ‘not at all’ consulted in the design of policies, plans and activities to reduce disaster risk, not given access to financial resources to reduce risks they face nor have access to timely and usable information to help them reduce risks. All these aspects make up an enabling environment that would positively influence effective policy and practice for anyone at risk. The lack of information (18%), lack of awareness (15%), and extreme poverty (14%) were the key factors preventing inclusion in the policy environment.
Reluctance to report on the local policy environment
Anecdotally, several displaced persons – especially women – did not want to answer questions on policy environment. This indicated a lack of ability, confidence, willingness or knowledge to even speak into this issue – the first step to then being able to advocate for change. Reasons for this have been suggested by enumerators which include lack of confidence to speak up, not understanding the policy environment (or question) at all and perceived political consequence or strong party political influence in their communities. Conclusions from our Views from the Frontline global report show that people cannot access information, rather than not being able to understand it – another important factor to consider.
Lack of accessibility
Further at-risk groups indicated their exclusion. Children under 15, some elderly and those benefiting from government welfare also, in parts, chose not to comment.
Corroborating with this finding are factors associated with recognition of displaced persons themselves. Those displaced less than one year suggest the biggest barrier is a lack of accessibility. Those who stated that they had not been officially recognised as displaced by their government, stated an absence of disaster risk management and development policies (19%), a lack of communication (17%) and government inefficiency (13%) stop an enabling environment for them being realised.
Unfortunately gender inequality was seen by far as the disaster risk driver that least affected displacement, indicating perhaps a lack of understanding on the issue and how it is increasing displacement risk.
Experience of displaced people in Niger
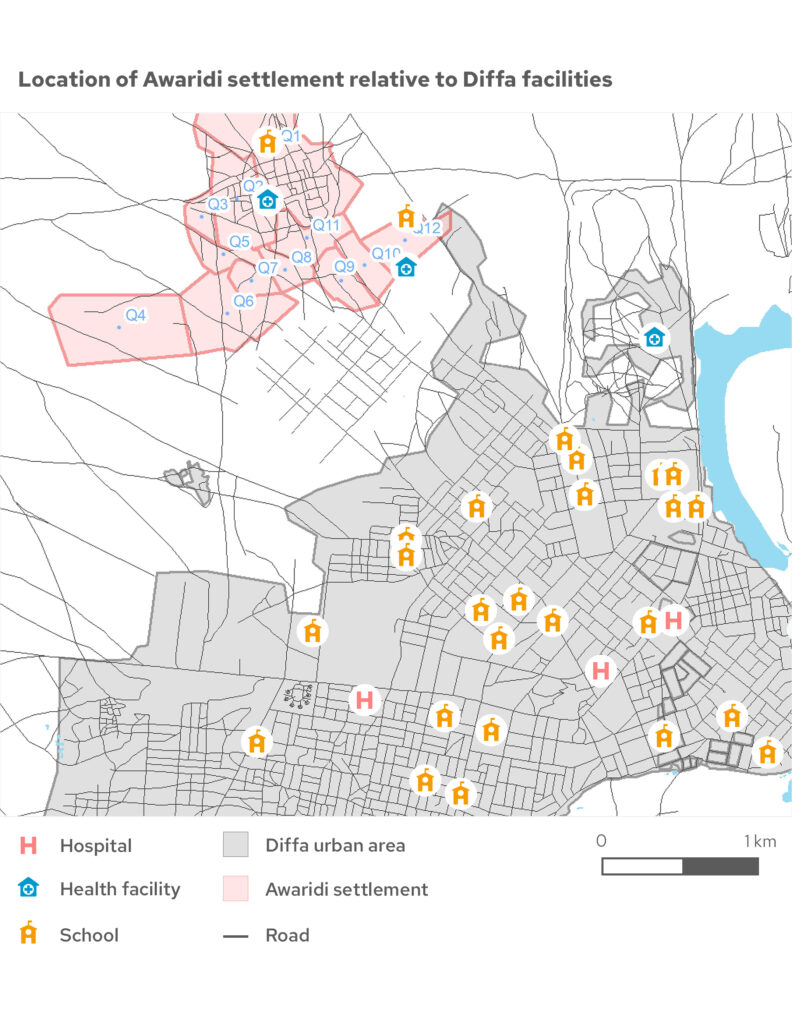
The map below shows Diffa, Niger, with the red area highlighting where the displaced live. A visual image of displaced living at the edges of cities which, as stated in other findings, limits their access to services. Subsequently, it also brings limitations to equitable access to the policy environment with key decisions made away from their community.
Conclusions and ways forward
Next chapterForced Displacement Global Paper
ContentsCredits
Main photo: Elisee, Grace and Philippe, at Bahn refugee camp, Nimba county, Liberia. Credit: DFID
Bar chart: Community-level data from our Making Displacement Safer programme.
Map: Produced by MapAction. Created 11/07/2021. Supported by the Bureau of Humanitarian Assistance. Data sources: DEMI-E, OpenStreetMap. The depiction and use of boundaries, names and associated data shown here do not imply endorsement or acceptance by MapAction.
Project funded by
United States Agency for International Development
Our Making Displacement Safer project is made possible by the support of the American People through the United States Agency for International Development (USAID) – Bureau for Humanitarian Assistance. Content related to this project on our website was made possible by the support of the USAID. All content is the sole responsibility of GNDR and does not necessarily reflect the views of the USAID.
Visit their websiteBecome a member
Membership is free and open to all civil society organisations that work in disaster risk reduction or have an interest in strengthening the resilience of communities.
Join GNDR